Generate realistic time series for demand, sales, metrics or sensor readings, with one independent series per product, store, device or patient, linked to the rest of your database.
Free trial for every new account. No credit card.
Monthly sales per store: each series gets its own baseline, trend and seasonality.
Sessions dip overnight and peak mid-afternoon, and every derived column is calculated from the others.
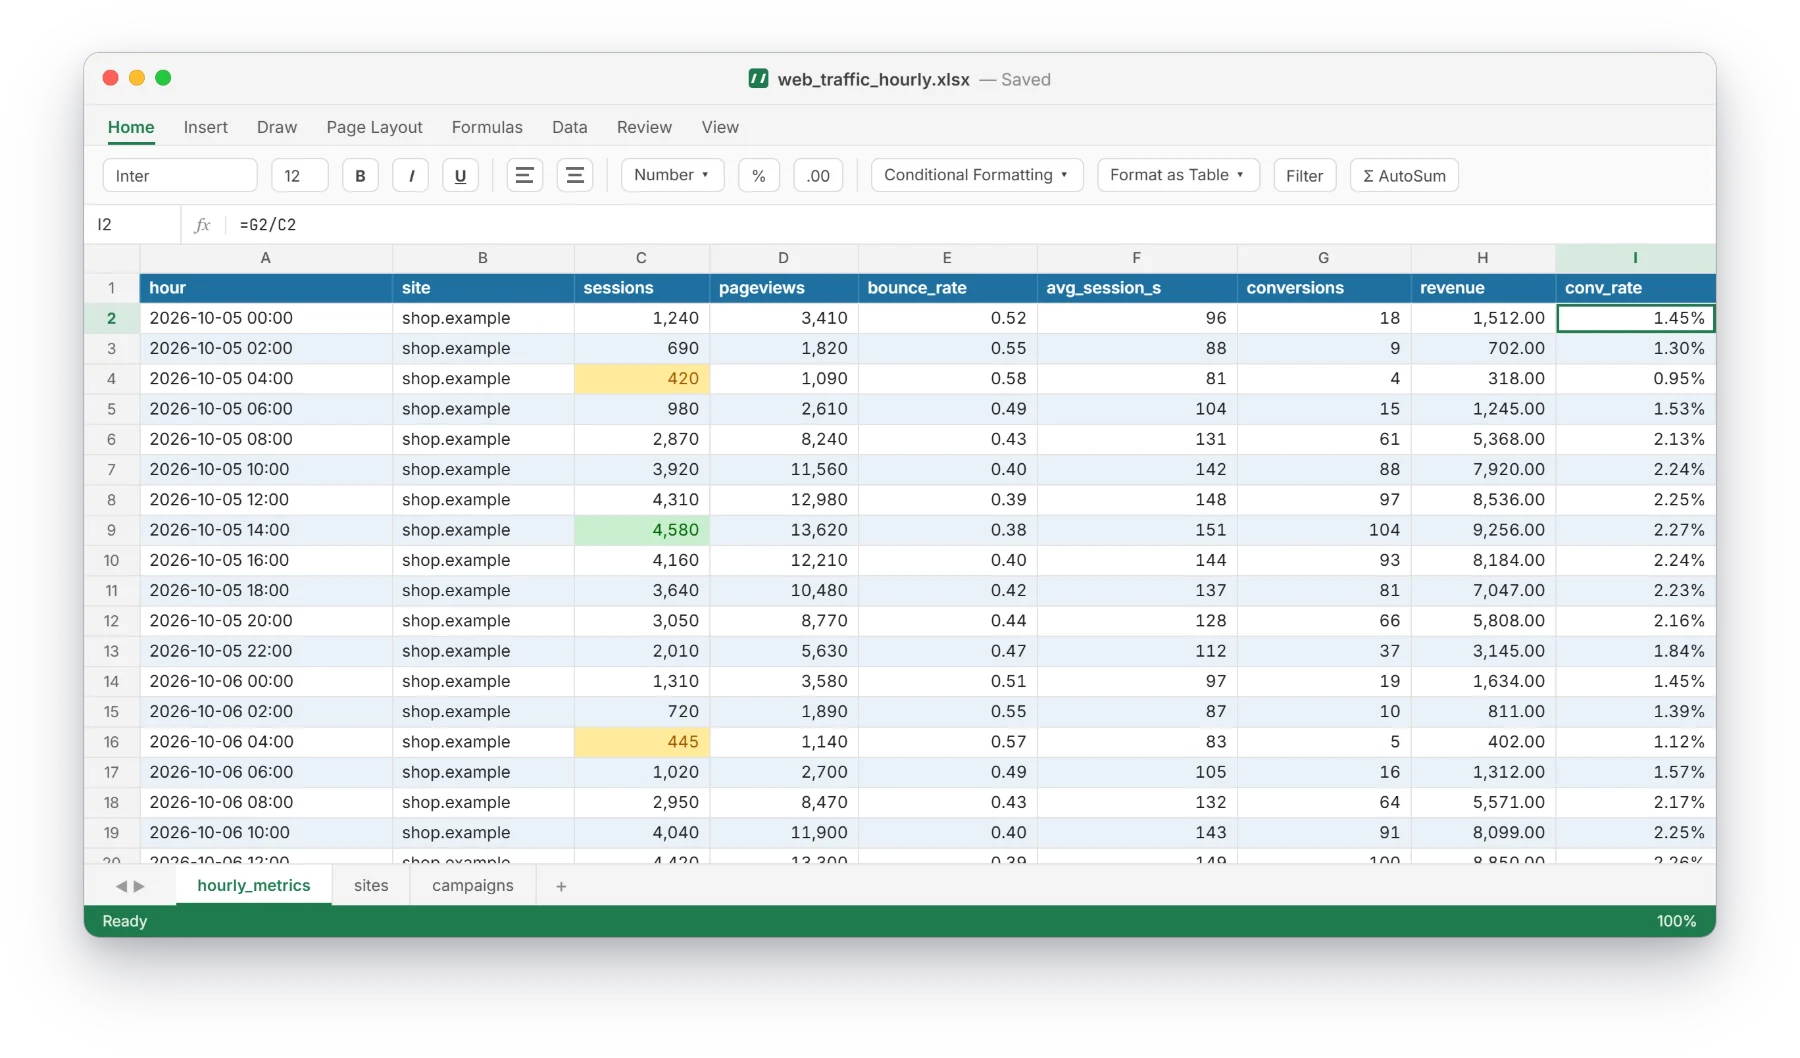
Hourly, daily, weekly, monthly, quarterly or yearly steps; monthly and longer steps follow the real calendar, so data lands on month boundaries.
Choose strict trend, overall trend, seasonal, seasonal plus trend or noisy, or let each series get its own random mix.
Every product, store or patient gets its own series with its own baseline, instead of one shared curve.
Vital signs and sensor readings wander around a realistic baseline instead of drifting off to impossible values.
Series reference your existing entities through foreign keys, so you can join them like real data.
Download as CSV, Excel, JSON or SQL and load straight into your notebook, BI tool or database.
Describe your data in plain English, or upload your SQL schema for PostgreSQL, MySQL / MariaDB, SQL Server and SQLite.
Check the tables, columns and rules the AI proposes, and adjust anything you like.
Choose how many rows you need and download a ready-to-run SQL script, CSV, Excel (one sheet per table) or JSON.
Yes. Each SKU gets its own monthly series with its own level, trend and seasonality.
Yes. Vitals are generated as mean-reverting signals around a realistic per-patient baseline. All values are synthetic.
Yes. Ask for a strict trend, seasonal data, seasonal plus trend or extra noise; otherwise each series gets a random mix.
Yes. The series contain realistic trend and seasonality, which makes them useful for testing forecasting pipelines and dashboards.
